
There’s nothing new about infographics. William Playfair, an 18th-century Scottish engineer and political economist, invented the line chart, bar graph and pie chart.
What has changed is the broad range of data and digital tools and the amount of information directed toward policymakers. That creates a need for researchers and visual designers to work together to create infographics that convey complex scientific information in powerful ways, says a new University of Washington paper.
Researchers at the Center for Public Health Nutrition at the UW School of Public Health teamed with graduate and undergraduate students of the UW’s Visual Communication Design program to create several food-related infographics featured in the research article.
“It’s a great collaboration between design and public health—on how infographics could help inform policy makers about scientific research,” says co-author Karen Cheng, a professor of visual design in the UW’s School of Art, Art History and Design.
Such partnerships aren’t common but are needed to make an impression on busy policymakers who are inundated with information, says Jennifer Otten, assistant professor of health services and first author of the article, which appeared in Health Affairs.
“Infographics provide an effective means to communicate health and nutrition data to decision-makers, who need high-quality information but in bite-size and readily accessible forms,” Otten says.
The authors note that infographics can be fast and effective because visual processing is the brain’s most dominant capacity. “The human visual system is so well developed that people can get the sense of a visual scene in less than one-tenth of a second,” they write.
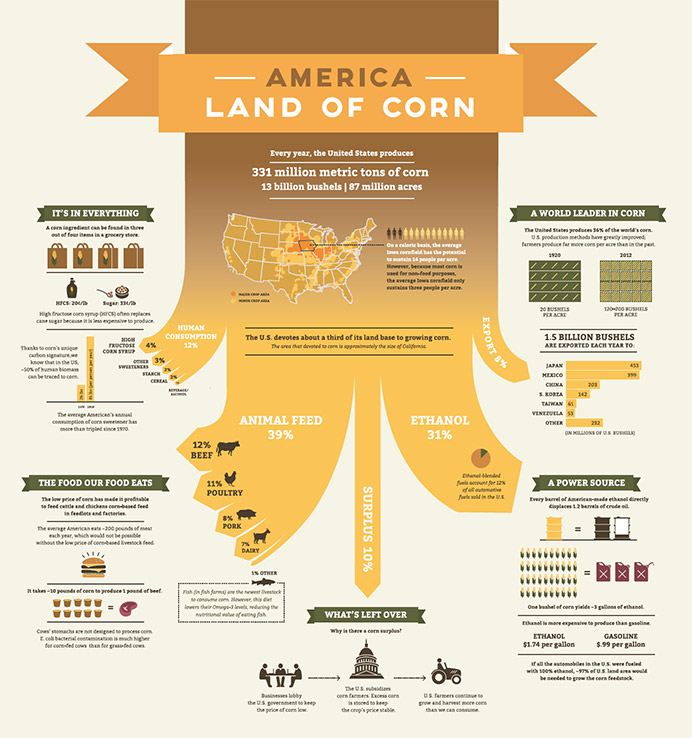
One of the student-created graphics illustrates the problem of food waste in the U.S. and suggests possible policy solutions. Another shows the three main methods by which fish are harvested in the U.S. A third traces the use of corn in America. Each is designed to be either persuasive, explanatory, or editorial.
Adam Drewnowski, professor of epidemiology, was a co-author of the paper.